


Pay per click advertising can deliver exceptional results for your business, but only if you know what to measure. Without tracking the right metrics, you’re essentially flying blind; unable to determine whether your ad spend is generating real value or simply draining your budget.
Thankfully, PPC platforms provide a wealth of data to help you evaluate performance. The challenge is knowing which metrics matter most and how to interpret them. In this guide, we’ll walk you through the essential PPC metrics every marketer should monitor.
Impressions: Your Campaign’s Visibility
Impressions represent the number of times your ad appears on a search results page or website. While this metric doesn’t tell you whether anyone clicked your ad, it provides valuable insight into your campaign’s reach and visibility.
A high impression count with low clicks might indicate that your ad copy isn’t compelling enough, or that you’re targeting keywords that aren’t quite right for your audience. Conversely, low impressions could suggest your bids are too conservative or your targeting is too narrow.
Clicks: Measuring Initial Interest
Clicks tell you how many people were interested enough in your ad to take action. This is where you start to see actual engagement with your campaign. Every click represents someone who saw your message and decided it was worth investigating further.
However, clicks alone don’t tell the full story. A high number of clicks is meaningless if those visitors don’t convert into leads or customers. That’s why clicks should always be evaluated alongside other metrics like conversion rate and cost per acquisition.
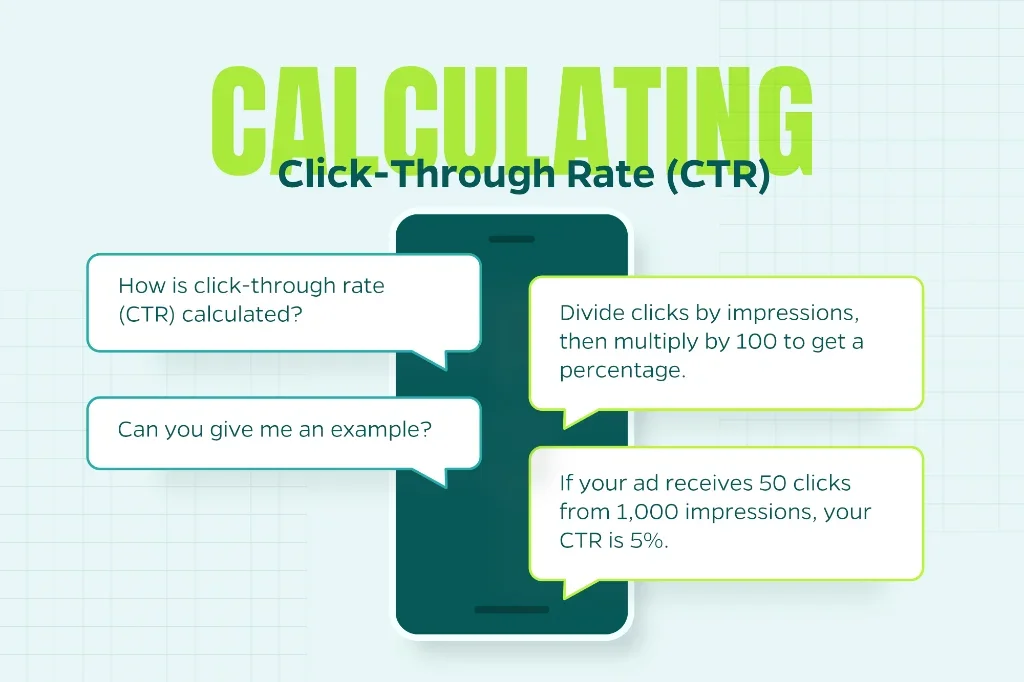
Click-Through Rate (CTR): The Engagement Indicator
Your click-through rate is calculated by dividing clicks by impressions, then multiplying by 100 to get a percentage. For example, if your ad receives 50 clicks from 1,000 impressions, your CTR is 5%.
CTR is one of the most telling metrics for ad effectiveness. A strong CTR indicates that your ad copy resonates with your target audience and that you’re bidding on relevant keywords. Search engines like Google also use CTR as an indicator of quality, which can affect your ad position and cost per click.
So, what constitutes a “good” CTR? It varies by industry, but (generally speaking) a CTR above 2% for search ads is considered decent, while anything above 5% is excellent. Display ads typically have lower CTRs, often below 1%.
Cost Per Click (CPC): Understanding Your Investment
Cost per click reveals exactly what you’re paying each time someone clicks on your ad. This metric is influenced by factors including keyword competition, quality score, ad rank, and your maximum bid settings.
Monitoring CPC helps you manage your budget effectively and identify opportunities for optimization. If your CPC is climbing without a corresponding increase in conversion quality, it may be time to refine your keyword strategy or improve your ad relevance.
Conversion Rate: The Bottom-Line Metric
Conversion rate measures the percentage of clicks that result in a desired action, whether that’s a purchase, form submission, phone call, or another goal you’ve defined. This is calculated by dividing conversions by clicks.
A conversion rate of 2-5% is typical for many industries, though this can vary significantly based on your sector, offer, and target audience. Your conversion rate is perhaps the most important metric because it directly reflects how well your traffic converts into business results.
Low conversion rates despite healthy CTRs often point to issues with your landing page, offer, or audience targeting rather than your ads themselves.
Cost Per Acquisition (CPA): Evaluating True Campaign Efficiency
Also known as cost per conversion, CPA tells you how much you’re spending to acquire each customer or lead. This is calculated by dividing your total ad spend by the number of conversions.
CPA is critical for determining campaign profitability. If your CPA is $50 but your average customer value is $200, you’re in good shape. If those numbers are reversed, you have a problem that needs immediate attention.
The most successful PPC campaigns balance volume with efficiency, scaling up when CPA is favorable and pulling back or optimizing when it climbs too high.
Return on Ad Spend (ROAS): The Profitability Picture
ROAS measures the revenue generated for every dollar spent on advertising. It’s calculated by dividing revenue from ads by the cost of those ads. For example, if you spend $1,000 on ads and generate $5,000 in revenue, your ROAS is 5:1, or 500%.
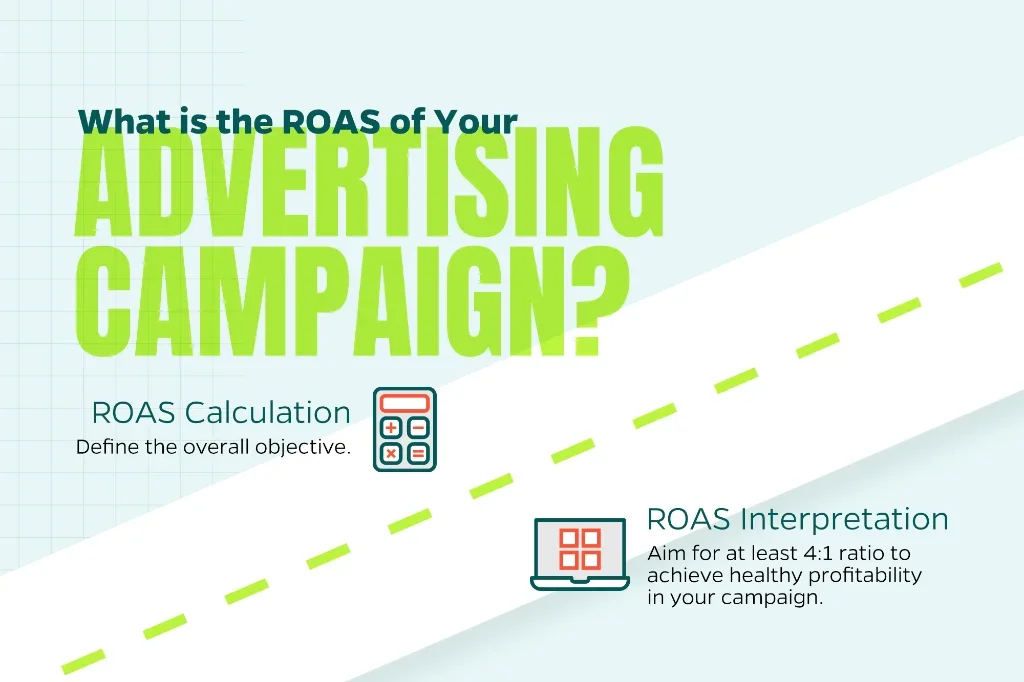
This metric is particularly valuable for e-commerce businesses and any company that can directly attribute revenue to PPC campaigns. A profitable ROAS depends on your margins, but most businesses aim for at least 4:1 to ensure healthy profitability after accounting for other costs.
Quality Score: Google’s Performance Grade
Google assigns each of your keywords a Quality Score from 1 to 10 based on expected CTR, ad relevance, and landing page experience. This score significantly impacts both your ad position and how much you pay per click.
Higher Quality Scores lead to lower costs and better ad positions. Improving your score requires creating highly relevant ads, selecting appropriate keywords, and ensuring your landing pages deliver on your ad’s promise. Even small Quality Score improvements can meaningfully reduce your CPC over time.
Impression Share: Capturing Your Market Potential
Impression share reveals what percentage of available impressions your ads are receiving. If your impression share is 60%, your ads are showing for 60% of the times they’re eligible to appear.
This metric helps you understand whether you’re missing opportunities due to budget constraints or low ad rank. Lost impression share data breaks down exactly why you’re not capturing 100% of available impressions, allowing you to make informed decisions about increasing bids or budgets.
Putting It All Together
Effective PPC management isn’t about obsessing over any single metric. Instead, it requires understanding how these metrics interact and tell a complete story about your campaign performance.
Regular analysis of these metrics will help you identify what’s working, spot problems before they drain your budget, and continuously optimize your campaigns for better performance. The most successful PPC advertisers treat these metrics not as static numbers but as a dynamic dashboard that guides ongoing strategy and tactical adjustments.
Need help managing a PPC strategy? Our experts can help. We have had proven success helping companies achieve ROI from their PPC campaigns. Interested? Contact Straight North to learn more.