


Key Takeaways:
- Automate the collection, comparison, and formatting of SEO data, but keep strategic judgment and client-facing commentary in human hands.
- Not every metric belongs in a dashboard; only track data that’s regularly reviewed, reliable, and tied to a real decision.
- GA4 and Google Search Console can be connected to tools like Looker Studio to automate recurring performance comparisons.
- Combining rankings, traffic, and conversions in one view reveals patterns — like strong rankings with weak conversions — that no single metric shows alone.
- AI can draft summaries and flag anomalies, but every claim needs human review before it reaches a client.
A strong SEO report should tell clients and stakeholders more than what happened. It should show how search visibility, organic traffic, conversions, and technical performance are changing, explain what those changes mean for the business and identify what should happen next.
Automation can handle much of the recurring work behind that report. Once the right metrics and parameters are established, a dashboard can collect performance data, flag significant changes, and surface potential trends, such as declining traffic to a high-value service page. But it still takes an SEO strategist to determine whether that decline stems from a ranking change, shifting search intent, a technical issue, or increased competition, then recommend the best response.
In a recent Straight North blog, SEO & GEO Automation Expert Nick Fatigato explained how coding agents can automate reporting tasks. Here, he explores the next step: deciding what an SEO report should include, which parts of the process to automate, and where human strategic insight remains essential.
SEO reporting automation should do more than save time. By automating repetitive data collection, organization, and initial analysis, SEO teams can focus on the context and strategic judgment needed to turn performance data into meaningful action.
Start With the Questions Your SEO Report Needs to Answer
Talk to the client or stakeholder to determine what information they are seeking from your SEO report. Then, you can decide which tools you need to pull that report and what metrics you should be gathering for them.
Useful SEO reports should be able to answer the following questions:
- Is organic visibility improving?
- Which pages and queries are gaining or losing performance?
- Is organic traffic contributing to conversions or revenue?
- Are technical issues limiting results?
- What work was completed during the reporting period?
- What should be prioritized next?
Next, determine the client’s experience level and business goals. That will guide the context with which you provide the data and feedback.
Core Elements of an SEO Report
How you build an SEO report from the ground up really depends on who’s going to be reading it.

The types of metrics you’ll convey to those two different clients are going to be varied. But I would say the practical steps were… would be to have some sort of executive summary in your report, what happened this month, this quarter, this year, and then to also include a performance snapshot for those KPIs that you have decided are the most important. So that could be traffic, conversions, leads, revenue, whatever that might be. And then, of course, an important element of SEO is search visibility, so that could be rankings from Search Council or some third-party tool that you gather data from, and then analyzing the pages with the most clicks, most impressions, click-through rate, those types of things. So, those are some of the core elements that I would include on an SEO report, whether it’s a monthly report, a quarterly report, or an annual report.
The goal isn’t to dump every available metric into a report, it’s to answer the questions your specific client actually cares about. That means tailoring the report to where the client is in their SEO journey: a company new to SEO needs different context than one with a mature, established program.
His recommended structure includes:
- An executive summary covering what happened over the reporting period (monthly, quarterly, or annual)
- A performance snapshot of the KPIs that matter most to that client including traffic, conversions, leads, or revenue
- Search visibility data, including rankings and page-level performance (clicks, impressions, click-through rate)
- Technical health, crawling, and indexation but not necessarily every report, but included when relevant
- A clear account of completed work including what was implemented, what wasn’t, and how that explains the results
- Recommendations and next steps, prioritized based on what was learned
Every report should close with a clear point of view on what to do next, not just a summary of what already happened.
Decide Which SEO Metrics Are Worth Automating
Figure out what you’re actually trying to accomplish with the data first. Automation comes after that, not before. Not every available metric belongs in an automated dashboard.
A metric is a strong candidate when it is:
- Reviewed regularly
- Available from a stable, trustworthy source
- Interpreted consistently
- Useful for explaining a performance change
- Connected to a business outcome
- Time-consuming to collect manually
“Automating metrics that are recurring, stable and trustworthy, and able to tie to a decision, those are things that can be automated and worth automating from an SEO standpoint.”
Enterprise SEO & GEO Strategist | SEO & GEO Automation Expert
Common candidates include organic sessions, clicks and impressions, click-through rate, average ranking position, engagement, conversions, and revenue. The key is restraint: avoid turning the dashboard into a “digital junk drawer” of every metric you can pull. Every automated metric should earn its place by helping answer a question or support a decision. If it doesn’t do either, leave it out.
How to Automate SEO Reports With GA4 and Google Search Console
For many SEO teams, the simplest starting point is connecting GA4 and Google Search Console to Looker Studio. Google Sheets can also work as a reporting destination through direct exports, connectors, or API integrations. Think of it like assembling a dish: once you’ve got your ingredients (data sources) and your method (structure) in place, the automation does the prep work, but the strategist still has to cook the meal.
Here’s the recipe:
Step 1: Define the Reporting Question
Before connecting anything, decide what you’re actually trying to track. Which pages, queries, conversions, or trends does this report need to monitor on an ongoing basis? If you get the setup right, everything downstream is easier.
Step 2: Choose a Consistent Reporting Destination
Pick one platform and stick with it across clients. Options include:
- Looker Studio
- Google Sheets
- An internal reporting workbook
- A custom reporting platform
Step 3: Connect GA4 Data
Pull in the relevant dimensions and metrics, such as:
- Landing pages
- Traffic sources
- Devices
- Organic sessions
- Engagement rate
- Conversions
- Revenue
Step 4: Connect Google Search Console Data
Layer in page- and query-level performance data, including:
- Clicks
- Impressions
- CTR
- Average position
Step 5: Standardize the Data
Normalize URLs and establish consistent page categories, date ranges, filters, and naming conventions. This step doesn’t add flavor on its own but skip it and everything downstream gets messy.
Step 6: Create Useful Reporting Views
Organize the dashboard into views built around what actually matters: priority pages, queries, content categories, locations, services, products, or other meaningful groupings.
Step 7: Schedule Updates and Exports
Once your connections and views are set, automate the refreshes and recurring exports. Now your one-time report turns into a living dashboard that requires far fewer manual pulls.
Combine Rankings, Traffic, and Conversions in One Report
Rankings, traffic, and conversions offer limited insight in isolation. As Fatigato explains, this is one of the highest-value automations you can build, because it connects visibility to actual business impact. It shows whether stronger search presence is attracting the users who matter, not just more users.
To build this unified view, start by pulling the raw data:
- Pull query, page, and position data from Google Search Console — rank tracker data by keyword, date, or position.
- Pull landing-page traffic and conversion data from GA4.
- Normalize URLs so records from both platforms cross-reference cleanly, without duplicates.
From there, here’s how it comes together:

And then you can group those pages by different types of, I guess, subfolders on your website, whether that be services, products, locations, blogs, resources, so this then builds a unified view for each of those categories, where you can flag different things, like rankings without conversions, traffic with weak engagement, or converting pages with low visibility. So you have all these different metrics side by side from different data sources that will help you tell a better story. For example, if you’re, you know, ranking really well for a page but you’re noticing that there’s not a lot of engagement, well, it turns out that could be maybe something more related to conversions, and how people, interact with the page once they’re there. We know that we’re visible, we know that we’re getting traffic, but no one’s converting, so there has to be something that matches up. And those different data sources can help you tell that story and make a more informed decision.
This combined view surfaces patterns that no single data source would reveal on its own:
- Strong rankings but few conversions
- High traffic but weak engagement
- Converting pages with limited visibility
- High impressions but low CTR
- Pages ranking just outside the top results
These patterns give the strategist a clearer starting point for diagnosing the problem — whether a page needs SEO improvements, stronger conversion elements, updated content, or a different approach entirely. Cross-referencing these data sources is what turns disconnected metrics into a coherent story.
Use AI to Draft SEO Reporting Summaries
Once you’ve got all this data flowing in, someone still has to turn it into something a client will actually read. That’s where AI comes in.

Another great use case for AI, everyone has at least had some experience by now using something like ChatGPT, or Claude, or Copilot, whatever these different AI platforms are built into our daily tools, or just stand-alone platforms. They certainly can draft summaries, identify unusual changes, and then translate those structured tables into more plain English, so it should not send the final commentary without review. AI lacks the client-specific history needed to distinguish things like seasonality or tracking changes, migrations, implementation delays. Those are all things that maybe would not have the knowledge behind the data to understand, so there’s always a necessary human review aspect of these AI summaries, but obviously AI can analyze and group all of that data much quicker than we can as humans.
Here’s a practical workflow for getting the best output from it.
- Provide verified performance data to the AI tool.
- Specify which metrics, page groups, or time periods to analyze.
- Ask it to identify significant changes and uncertainties.
- Verify every claim against the original data.
- Add client and market context.
- Rewrite the summary in the agency’s voice before delivery.
AI-generated commentary should never be sent directly to a client without review. It may not know about seasonality, migrations, tracking changes, implementation delays, business changes, or algorithm updates that affected the results. Humans still need to be the final review.
Create Alerts for Meaningful Traffic and Ranking Changes
Automated alerts help SEO teams catch potential problems without manually reviewing every page every day. Tools like GA4 Custom Insights and connected reporting platforms can monitor for conditions such as:
- Organic sessions falling by a defined percentage
- Conversions declining on a priority page
- A high-value keyword dropping several positions
- Impressions or clicks changing significantly
- A Search Console connection or data feed failing
Catching every fluctuation isn’t the goal. But catching the right ones is.
Set Thresholds Based on Business Impact
Not every dip deserves an alert. Losing 10 visits to an older blog post is a very different problem than a 30% traffic decline on a lead-generating service page, so alerts need to reflect that difference in stakes. That means tailoring thresholds to specific page types or individual pages, focusing attention on high-priority content, adjusting for the volatility that’s normal for a given page, and routing each alert to the person responsible for investigating it. An alert that fires constantly for low-stakes noise trains people to ignore it. The goal is signal, not volume.
Create an Investigation Checklist
Once an alert is properly tuned, it should mark the start of an investigation, not the end of one. An alert can tell you what changed, but not why, as that still requires a strategist to dig in. When one triggers, work through the likely causes.
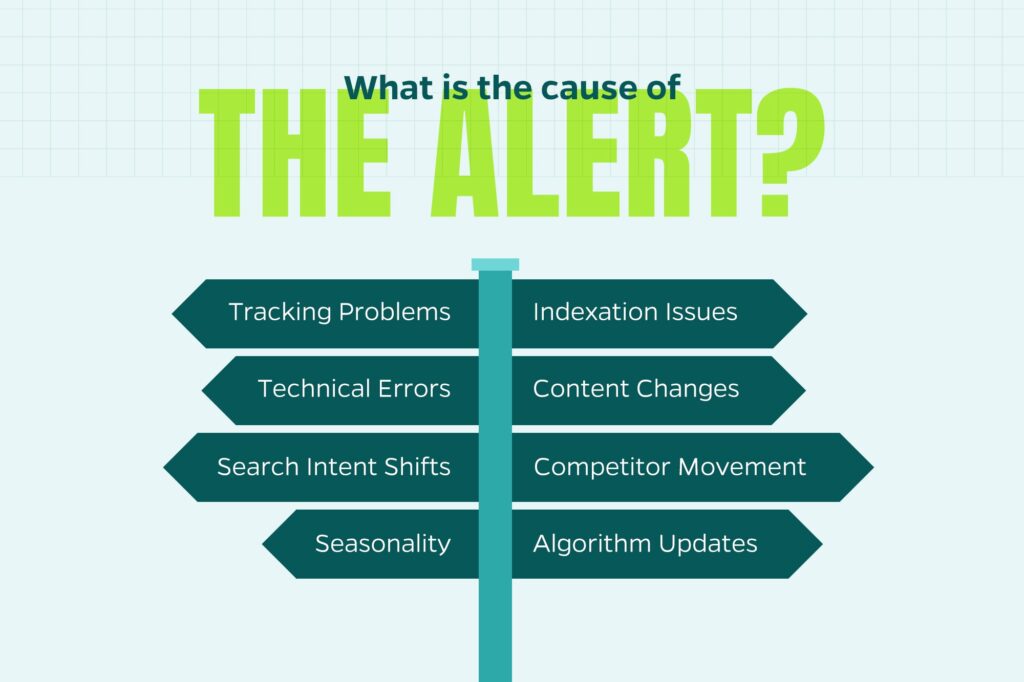
Working through this list systematically keeps the team from jumping to conclusions, or worse, reporting a “decline” to a client that turns out to be a tracking bug rather than an actual performance issue.
What Parts of SEO Reporting Should Not Be Automated?
Automation is great for recurring, structured tasks like pulling data, tracking metrics, flagging changes. Knowing when to use automation matters just as much as knowing how to use it. Anywhere context, judgment, or client communication is involved, that’s a signal to slow down and bring in a human.
Do automate:
- Data pulls from GA4, Search Console, and other connected sources
- Recurring dashboard updates and scheduled exports
- Alerts that flag when a metric crosses a defined threshold
- First-pass drafts of summaries or structured tables
Don’t fully automate:
- Final client-facing commentary
- Strategic recommendations
- Explanations for traffic or ranking changes
- Algorithm update analysis
- Competitive interpretation
- Forecasting
- Prioritization
- Final quality control
The line comes down to this: automation can tell you that something changed. It takes a strategist to determine why it changed, why it matters, and what should happen next. AI can help narrow down possible causes behind a traffic drop or ranking shift, but it won’t have the client history, past conversations, or contextual judgment to give you the full picture. The same goes for recommendations, as they should come from your own analysis of the data, not from a tool making the call for you.
Even when automation and AI do the heavy lifting of gathering and organizing information, the final version that actually reaches a client should always carry your own thinking, your own spin, and your own voice.
Make Automated SEO Reports More Actionable
An actionable report starts with the decisions it needs to support, not the volume of data it can display. The question shouldn’t be what metrics you can show; instead, it should be what actions someone can take once they’ve read them.

When you’re trying to make a report that’s actionable, and not just a bunch of data being thrown at someone, I would start with the decisions, not the data. So, the report sahould be built around the action someone might take after reading it. So, instead of asking, what metrics can we show, ask, what pages should we optimize next? What content is losing visibility? What keywords are close to page 1? Which ones can we improve? What technical issues are blocking performance? What pages are driving the most leads? What pages get traffic but fail to convert? And what work should be prioritized to address all of these things next month? So, instead of saying, what metrics can we show, actually think about the things and the actions you can take that come out of that data. We’re always going to show a lot of metrics and data when it comes to SEO reporting, but the more valuable, you know, strategic expertise we can provide to our clients is what to do with that data.
Putting that mindset into practice comes down to four things: how you organize findings, how you decide what’s worth flagging, how you connect findings to action, and how you prioritize what gets done first.
Organize Findings Around Decisions
Rather than presenting data by metric or data source, group insights into categories that map to the decisions they’re meant to inform:
- Content opportunities
- Technical priorities
- Ranking opportunities
- Conversion opportunities
- Declining assets
Use Consistent Thresholds
Once findings are organized, you need a consistent bar for what counts as worth flagging in the first place. Examples might include:
- High impressions with low CTR
- Rankings in positions 4–15
- Traffic declines greater than 20%
- Conversion declines greater than 15%
These thresholds should be adjusted to the website’s baseline performance and business priorities. For example, what counts as a meaningful decline on a high-traffic page may be noise on a low-traffic one.
Pair Every Finding With a Recommended Action
With findings organized and thresholds set, the next step is making sure every flagged issue leads somewhere. Keep the observation and recommendation distinct, so it’s clear what was found versus what should be done about it:
- Observation: Clicks to a priority page declined.
- Recommendation: Refresh outdated content and strengthen internal links to the page.
Prioritize by Impact and Effort
Finally, not every issue deserves the same urgency. Once you’ve paired findings with recommendations, rank them by potential impact and the effort required to act on them. That way the report tells the client not just what to do, but what to do first.
The First SEO Reporting Task to Automate
If you’re just getting started with automation, don’t try to overhaul everything at once. A good first step is setting up a recurring Google Search Console performance comparison. It’s simple to build and gives you an immediate sense of what’s working.
“The very first, place SEO agencies start when looking at data is Google Search Console. It’s our one true first-party source from Google about all our organic metrics.”
Enterprise SEO & GEO Strategist | SEO & GEO Automation Expert
Here’s what a basic version of this report can do:
- Pull page-level data for the last 28 days
- Pull the previous 28 days so you’ve got something to compare against
- Calculate the changes in clicks, impressions, CTR, and average position
- Flag your biggest gains and declines
- Identify pages with high impressions but low CTR, which is a classic sign something’s off with the title tag or meta description
- Isolate pages ranking in positions 4–15, as those are often your best near-term opportunities
- Send everything to an SEO professional to actually dig into
Start sitewide to get the lay of the land, then once that’s running smoothly, refine it further by breaking things out by page category, subfolder, service line, or content type.
Measure Whether Reporting Automation Is Actually Saving Time
Automation is only worth it if it’s actually saving you time without quietly costing you quality along the way.

We have all these automation processes, but does it actually save time? The simplest way to measure is to measure the process before and after the automation. So most teams know how long reporting takes, but they don’t always know where the time goes, so sometimes you could say, man, I spent 4 hours on this report, but you don’t know the nuance of every minute, you know. This took 5 minutes, this took 15 minutes, so you kind of just generally know this process is going to take me a certain amount of time, so I’d start with timing each step manually, and then comparing it to the automated workflow. So whatever your steps are, document the manual processes, list every step, what usually you do when you’re going through a reporting process.
So how do you calculate real time savings? Log every export, calculation, and review step in your current process, and time each one. Then run the automated version, track those same steps, add in any time spent fixing errors, and compare the totals. That’s your actual answer, not just a gut feeling.
But time isn’t the only thing worth watching. While you’re at it, keep an eye on:
- Data accuracy
- Number of errors
- Time spent troubleshooting
- Consistency across reports
- Quality of the final analysis
- Time redirected toward strategic work
If your “automated” process ends up needing so much cleanup that you’re spending just as much time fixing it as you would’ve spent doing it manually, it’s not actually saving you anything. It just moved your work around.
Use Automation to Create More Time for Strategy
The takeaway is simple, SEO reporting automation works best when it sticks to what it’s good at — collecting, comparing, formatting, and sorting performance data — and steps aside for everything else. The moment you try to automate judgment, context, or client communication, you lose the thing that really makes a report valuable in the first place.
The goal was never to replace the strategist. It’s to hand that strategist better information, faster, so they can spend their time where it actually counts such as digging into why something changed, spotting the next opportunity, deciding what matters most, and explaining all of it to a client in a way that makes sense.
Think back to the recipe: automation can gather the ingredients, prep them, and lay everything out on the counter. But it still takes a strategist to decide what dish to actually make. As Fatigato puts it: “Automation can bring the groceries to the kitchen, but the SEO still has to cook the meal.”